Amazon Aurora - Global Database
Monitoring the Global Database
Amazon Aurora Database exposes a variety of Amazon CloudWatch metrics , which you can use to monitor and determine the health and performance of your database. In this lab, we will guide you on how to create a **CloudWatch Dashboard ** that monitors latency, I/O and cross-region replication data transfers.
We are dividing our monitoring Lab in two main tasks:
-
Generating load on the primary DB cluster
-
Monitoring Cluster Load and Replication Delay
In order to generate load on your Aurora Database, we will make usage of an AWS Systems Manager (SSM) Document. Before you proceed, please ensure that you have already configured the Session Manager Workstation detailed in the Connect to the Session Manager Workstation section of this workshop.
1. Generating load your Aurora Database Cluster
In order to simulate production load on your Aurora Database, we will use a benchmark script that is packaged into a AWS Systems Manager Command Document , that will be executed with the help of a AWS Systems Manager Run Command . If you’re not familiar with AWS Systems Manager or are curious about it’s use cases and applicability, please refer to this page..
If you’re not already connected to the Session Manager terminal, sign in following these instructions onto the Primary Region of your Aurora Database Cluster. Once connected, enter the following commands, replacing the placeholders appropriately.
Before proceeding, make sure you are Logged to the Primary Region.
aws ssm send-command \
--document-name "auroralab-sysbench-test" \
--instance-ids [ec2Instance]
What do all these parameters mean?
AWS Systems Manager can be used to execute commands on Managed Instances, which can be very useful in EC2 based environments to perform automated tasks. In this workshop, we are using these capabilities do help us launch a preconfigured script by using the Send-Command option with the following parameters:
document-name: The name of the SSM Document to be executed. This document was created by the CloudFormation Stack used in this workshop and it’s named auroralab-sysbench-test. The instance-ids parameter refers to the EC2 InstanceID that you are in.
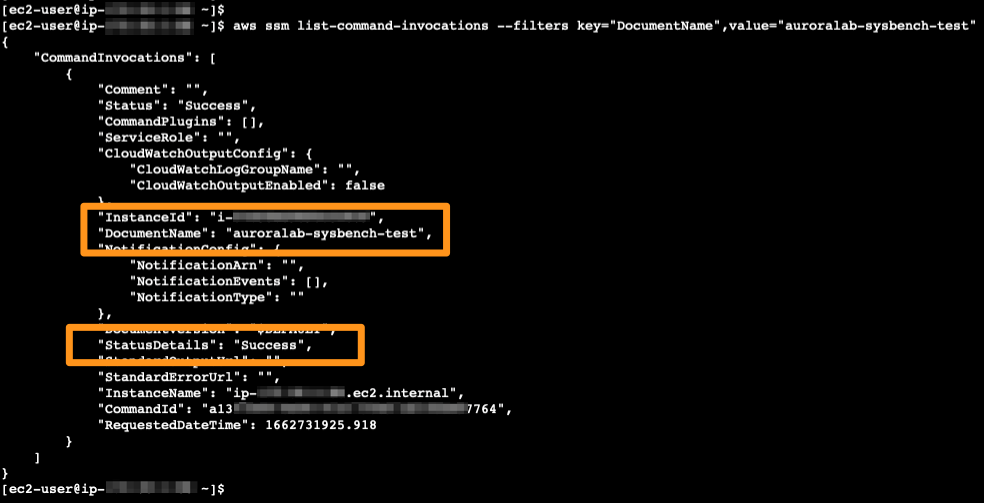
Once the SSM Send-Command is executed, you should check with the SSM Service that it ran successfully. The StatusDetails field will have the value "Success". The EC2 Instance will then start to prepare the load testing tasks. Please notice that it can take up to a minute for CloudWatch to reflect this test on it’s metrics.
aws ssm list-command-invocations \
--filters key="DocumentName",value="auroralab-sysbench-test"
2. Monitoring the Aurora Database Cluster load and replication.
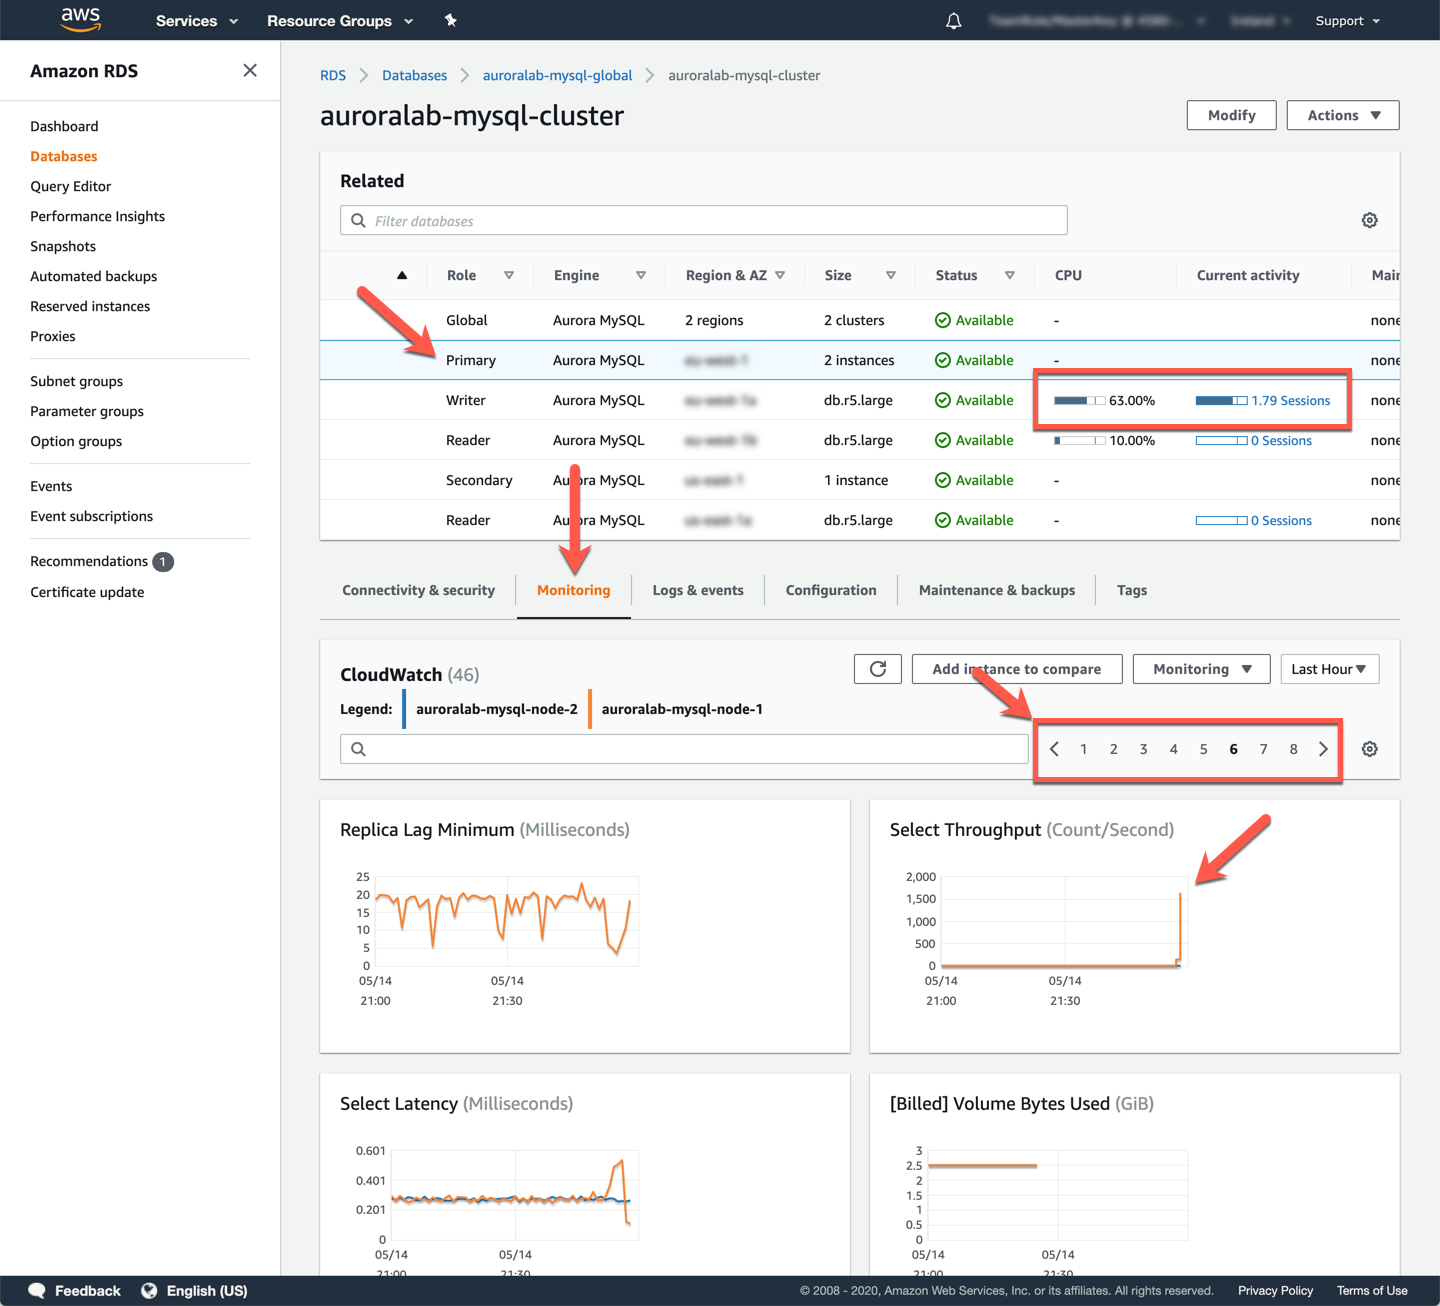
On the RDS service console on primary region, select auroralab-mysql-cluster (Regional Cluster) and switch to the Monitoring tab . You’ll see a combined view of the Writer and Reader nodes that composes cluster. Since you are not using the Reader Nodes at this time, the current load is being directed only to the Writer node. Browse the metrics section and note that the CPU Utilization, Commit Throughput, DML Throughput, Select Throughput metrics are quite stable, with some peaks caused by the SSM Document script execution that we performed previously.
Now, we will work with the Secondary Aurora Database cluster that was also created by the CloudFormation Stack. Our goal is to create a CloudWatch Dashboard that will be used to monitor three key metrics that are relevant to Global and Secondary Database clusters implementations. These metrics are:
AuroraGlobalDBReplicatedWriteIO: The number of Write operations (I/O) replicated to the secondary region
AuroraGlobalDBDataTransferBytes: The amount of redo logs transferred to the secondary region, in bytes
AuroraGlobalDBReplicationLag: How much, measured in milliseconds, the secondary region is behind the cluster in the primary region
You will work in the a secondary region in the subsequent steps: N. Virginia (us-east-1). Because you can have multiple browser tabs and command-line sessions open, please pay attention to the Region that your session is logged.
To create our Aurora Dashboard, open the Amazon CloudWatch console in the Secondary Region (us-west-1), in the menu Dashboards.
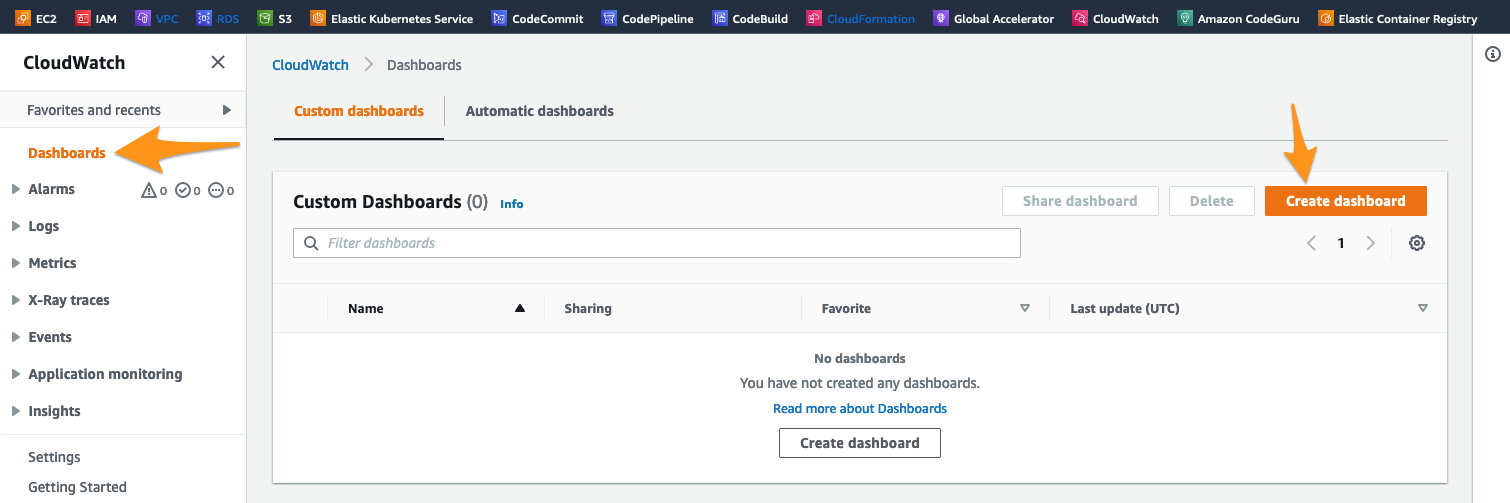
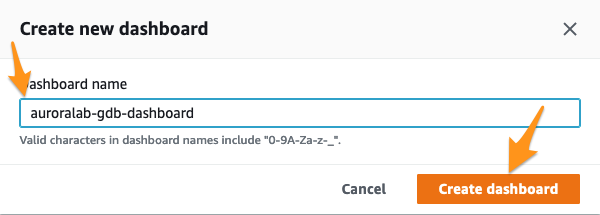
Click Create dashboard. Set the name of the new dashboard auroralab-gdb-dashboard and click Create dashboard.
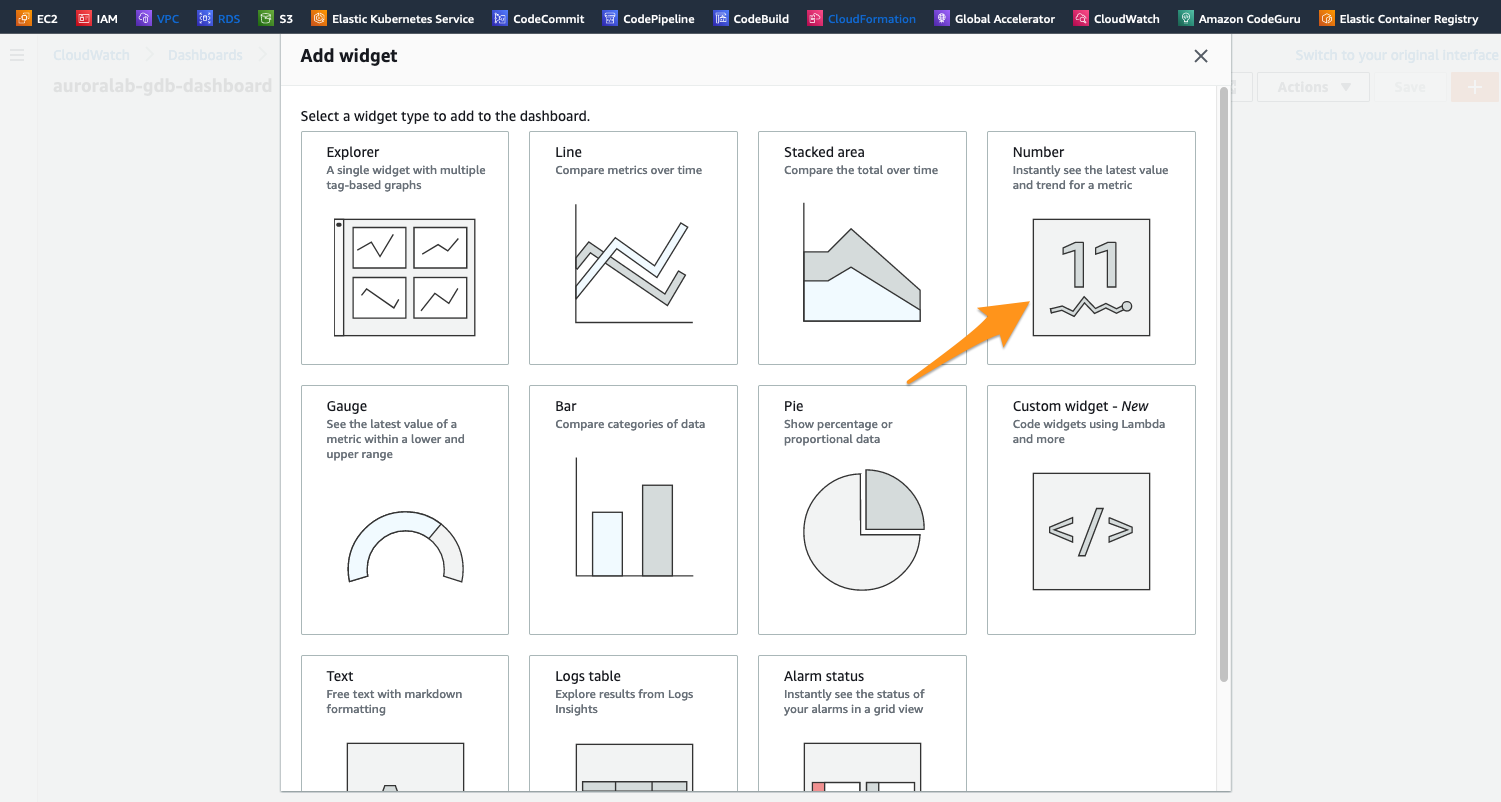
Let’s add our first widget to the dashboard that will be used to track the replication latency between the primary and the secondary Aurora clusters. Select the option Number and click Next.
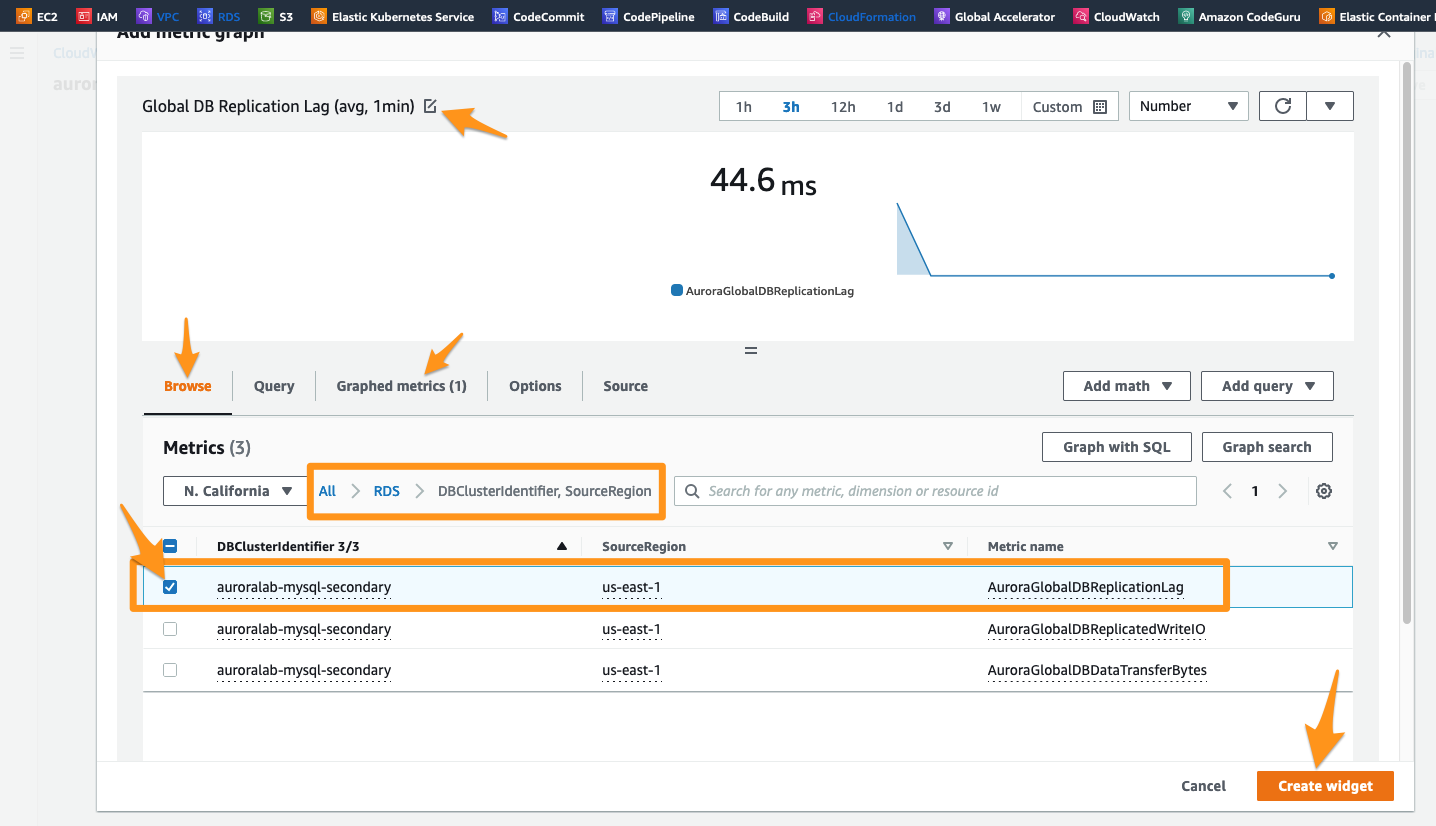
On the screen of Add Metric Graph, we will examine the tab Browse and at the Metrics section we will choose RDS and then we’ll select the metric group called DbClusterIdentifier, SourceRegion.
Now you should see a filtered metric AuroraGlobalDBReplicationLag, with the SourceRegion column as the name of your primary global cluster region (us-east-2). Select this metric using the check box and you will be able to see a preview on the panel at the top, with a sample of the delay time being reported in milliseconds. We will now provide a friendly name to this widget by clicking at the Edit icon (the “pencil” icon) that is next to the Untitled Graph default name.For this workshop, we we will name it Global DB Replication Lag (avg, 1min) and apply the changes.
Finally, select the Graphed Metrics tab at the bottom panel to further customize our view and change the Statistic option toAverage and the Period box to 1 minute .
Confirm that the settings are the same as the example below, and click Create widget.
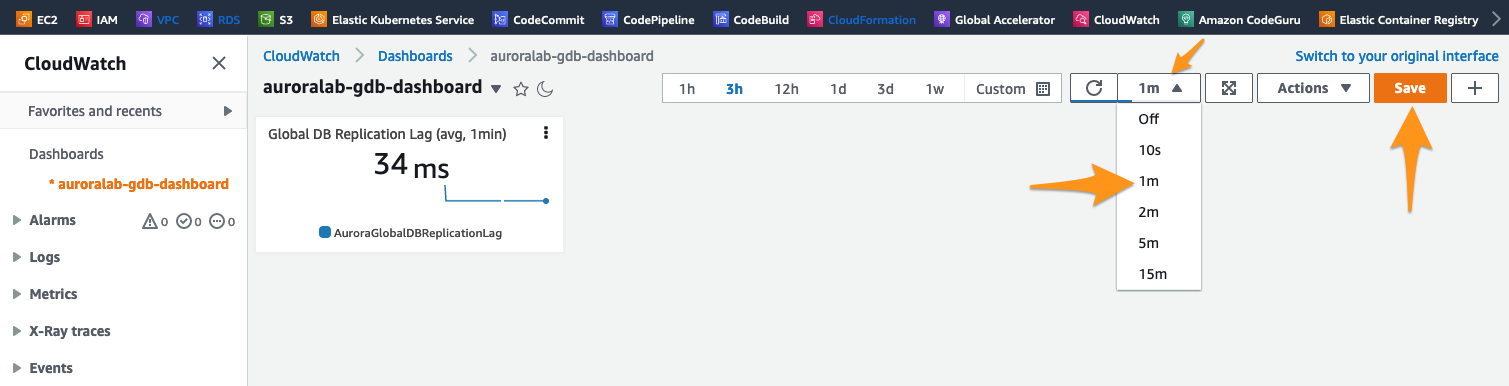
Now you’ve created your first widget. You can set an automatic update at a range defined in the refresh menu in the upper right corner.
Click Save dashboard to save the changes.
You can add widgets individually and manually to the dashboard to build a more complete monitoring panel to reflect your needs. However, to spare us some time, let’s use a JSON template that is already preconfigured with the widgets and metrics definitions that we will use during our workshop.
To import a JSON definition, click at the Actions button on the dashboard and choose View/edit source available at the drop-down list:
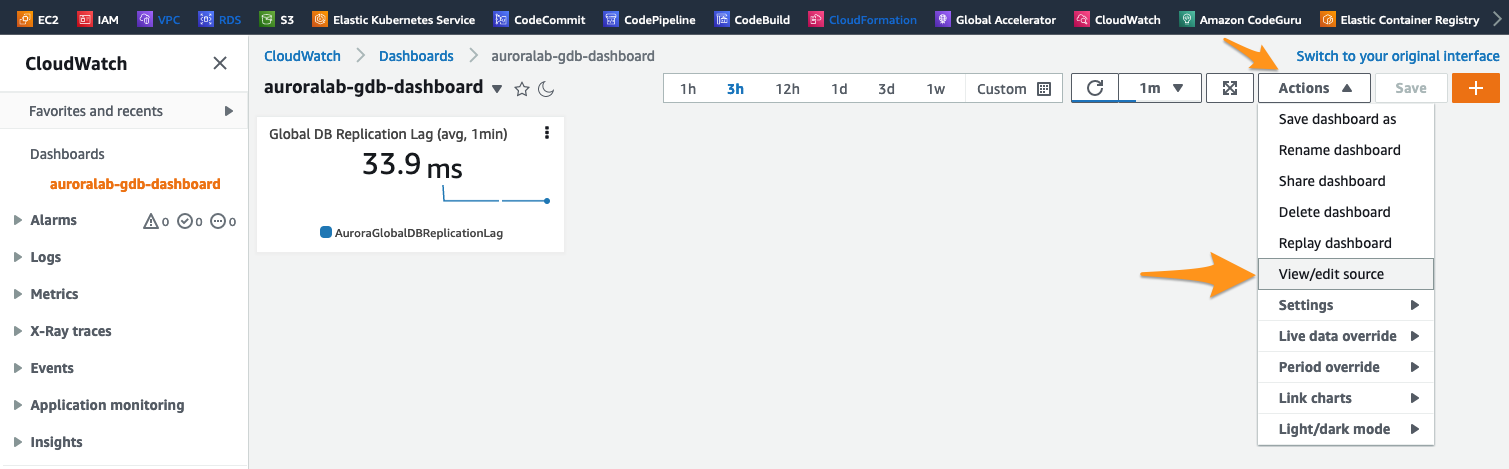
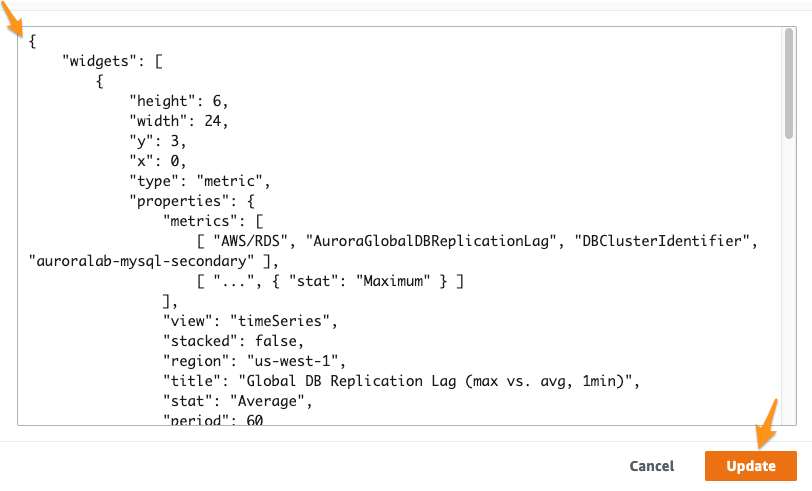
Next, copy and paste the following JSON code at pop-up text box. If you are not using the proposed Cluster Identifiers (names), please make sure to update the code below to match your definitions.
{
    "widgets": [
        {
            "type": "metric",
            "x": 0,
            "y": 3,
            "width": 24,
            "height": 6,
            "properties": {
                "metrics": [
                    [ "AWS/RDS", "AuroraGlobalDBReplicationLag", "DBClusterIdentifier", "auroralab-mysql-secondary" ],
                    [ "...", { "stat": "Maximum" } ]
                ],
                "view": "timeSeries",
                "stacked": false,
                "region": "us-west-1",
                "title": "Global DB Replication Lag (max vs. avg, 1min)",
                "stat": "Average",
                "period": 60
            }
        },
        {
            "type": "metric",
            "x": 0,
            "y": 0,
            "width": 9,
            "height": 3,
            "properties": {
                "metrics": [
                    [ "AWS/RDS", "AuroraGlobalDBReplicationLag", "DBClusterIdentifier", "auroralab-mysql-secondary" ]
                ],
                "view": "singleValue",
                "region": "us-west-1",
                "title": "Global DB Replication Lag (avg, 1min)",
                "stat": "Average",
                "period": 60
            }
        },
        {
            "type": "metric",
            "x": 9,
            "y": 0,
            "width": 15,
            "height": 3,
            "properties": {
                "metrics": [
                    [ "AWS/RDS", "AuroraGlobalDBReplicatedWriteIO", "DBClusterIdentifier", "auroralab-mysql-secondary", { "label": "Global DB Replicated Write IOs" } ],
                    [ ".", "AuroraGlobalDBDataTransferBytes", ".", ".", { "label": "Global DB DataTransfer Bytes" } ]
                ],
                "view": "singleValue",
                "region": "us-west-1",
                "stat": "Sum",
                "period": 86400,
                "title": "Billable Replication Metrics (aggregate, last 24 hr)"
            }
        }
    ]
}
To finish the JSON import process, click at the Update button. You will notice that new Widgets - such as Global DB DataTransfer Bytes and Global DB Replicated Write I/Os - were added to your dashboard.
Click Save dashboard to ensure that the dashboard is saved with the new changes.
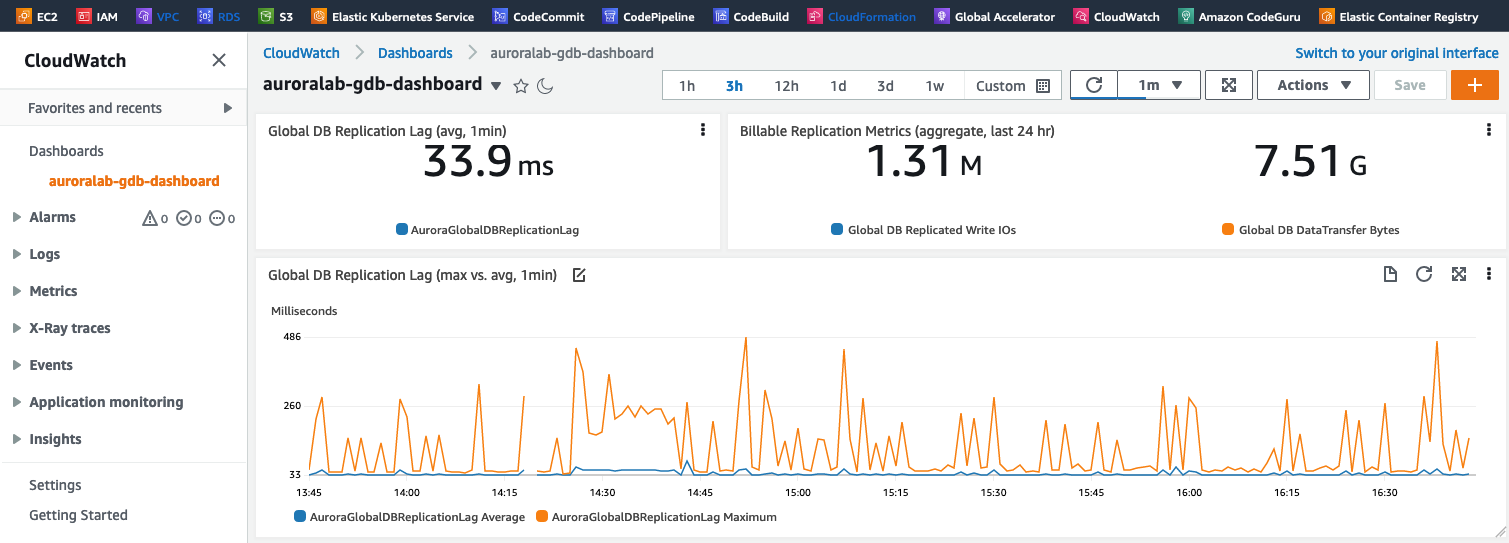
The metrics Aurora Global DB Replicated I/O and Aurora Global DB Data Transfer Bytes are only updated once an hour, so you may not be able to see data for those metrics if your Lab is running for less than one hour.